Investment Track Record
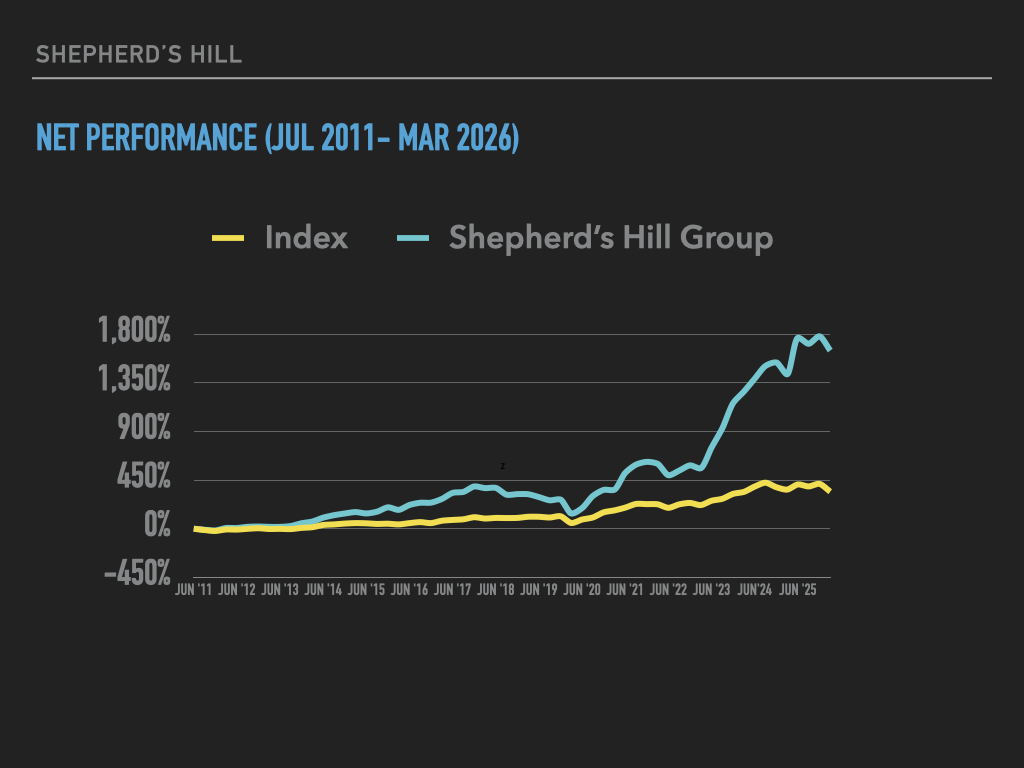
| Particular | 1 year | 3 year | 5 year | 10 year | Since Inception (Jul 2011) |
| Shepherd’s Hill Group | 14.32% | 38.36% | 30.52% | 20.33% | 21.41% |
| Benchmark – Index | -4.16% | 11.59% | 10.42% | 12.19% | 10.62% |
*Updated March 31, 2026
Long-Term Performance
Since Inception (July 2011 through March 2026 — approximately 15 years)
- Shepherd’s Hill Group: 21.41% per year, compounded
- Benchmark index: 10.62% per year, compounded
Over 15 years, this means the firm’s portfolios compounded at roughly double the rate of the index. At 21.41% per year, money doubles approximately every 3.5 years. At the benchmark’s 10.62% per year, money doubles approximately every 7 years.
Over the Past 10 Years
- Shepherd’s Hill Group: 20.33% per year, compounded
- Benchmark index: 12.19% per year, compounded
The 10-year figure shows the outperformance is not just a reflection of early years — it has persisted across a full decade, through multiple economic cycles, business downturns, and periods of market stress.
Over the Past 5 Years
- Shepherd’s Hill Group: 30.52% per year, compounded
- Benchmark index: 10.42% per year, compounded
Over the Past 3 Years
- Shepherd’s Hill Group: 38.36% per year, compounded
- Benchmark index: 11.59% per year, compounded
What This Means for a Patient, Long-Term Investor
A core principle of long-term, value-oriented investing is that small differences in the annual rate at which money compounds produce enormous differences in wealth over time. The gap between 21.41% and 10.62% per year — roughly 10 percentage points annually — is not a small edge. Sustained over 15 years, it represents a very large difference in ending wealth.
The 10-year and since-inception figures are the most meaningful for a patient investor, as they smooth out the noise of any single year and reflect performance across a wide range of economic conditions.
The outperformance has been consistent across multiple time horizons (3, 5, 10 years, and since inception), which reduces the likelihood that the long-term numbers are the result of a single fortunate period.
This means that, historically, wealth has grown faster and goals have been achieved at an accelerated pace by our investors compared to a passive index investor.
Important Caveats
Past performance does not guarantee future results. These figures reflect the firm’s history and are provided for informational purposes only. The numbers represent gross group performance and individual account results will vary based on the specific product, timing of investment, and applicable fees.